
What is the Local Control Funding Formula?
In 2013, California dramatically decentralized the school finance system, aiming to create a statewide system of control for local educational agencies (LEAs), which includes both school districts and charter schools. The newly adopted LCFF eliminated virtually all categorical programs resulting in LEAs having far more decision-making power, and control, over the strategic allocation of funds. This transformation created an emphasis on local control, equitable funding, and additional support for low-income, English Learners, and foster care youth, collectively referred to as unduplicated student groups.
The fundamental concept behind the LCFF is that LEAs receive funding in alignment with the specific needs of their student demographics. In LEAs where there is a greater number of unduplicated students, there is an increased allocation of funds, allowing for additional, strategic, investments in support of those students.
Here is How LCFF Works
Base Funding:
All districts receive a base grant for each student. The base grant is larger for grades 9-12 than for other grade levels.
Supplemental Funding:
LEAs and districts receive an additional 20% funding per student for unduplicated students (up to 55% of the unduplicated population), specifically defined as English Learners, socio-economically disadvantaged, and/or in foster care.
EX: A district where 35% of the students are classified as unduplicated first receives the base allocation for all students, and then 120% of the base rate for the 35% of unduplicated students. See below for additional funding allocations for LEAs and districts that exceed the 55% on unduplicated student threshold.
Concentration Funding:
LEAs and districts receive additional funding if more than 55% of students in the LEA or district qualify as unduplicated. Specifically, the district receives an extra 65% of the base grant for each unduplicated student beyond the 55% threshold.
EX: A district where 60% of the students are classified as unduplicated first, receives the base allocation for all students, and then 165% of the base rate for 5% of its students (the difference between 55% and the percentage of unduplicated (60%))
Under LCFF, the use of funds is substantially unrestricted, meaning that LEAs and school districts have a lot of latitude, so long as they spend funds in alignment with the intent of the law.
One important requirement of the Local Control Funding Formula is that LEAs and districts must engage parents, and the community, in the creation of their Local Control and Accountability Plan (LCAP). LEAs and school districts also use the LCAP to formally document their goals and plans, organized into eight priority areas.
The Local Control Accountability Plan (LCAP) is intended to provide transparency related to the actual use of LCFF funds.
Accountability Model
California’s accountability system is based on multiple measures that assess how local educational agencies (LEAs) and schools are meeting the needs of their students. Performance on specific measures (state-level and local-level indicators) is reported annually on the California School Dashboard. This current system is intended to give a complete picture of the “health” of a school system and aims to demonstrate how the school system is striving towards producing equitable outcomes for ALL students through assessment and accountability measures. It embraces a continuous improvement mindset in alignment with the strategic allocation of financial and human resources.
State Level Indicators
California School Dashboard reports performance for the following state indicators: English Learner Progress, Academics, Chronic Absence, graduation Rate, Suspension Rate, and College and Career Readiness. A brief overview of each indicator is included below, and the CDE has developed an additional helpful resource to unpack these further.
English Learner Progress (Priority 4)
The English Learner Progress indicator is intended to demonstrate the progress that English learner students are making towards proficiency in English. Each year, all students, grades kindergarten through through grade twelve, who are English learners complete the English Language Proficiency Assessments for California (ELPAC), an assessment designed to measure their knowledge and understanding of English. The results of the ELPAC generate the performance level on the English Learner Progress indicator.
Academics: ELA and Mathematics (Priority 4)
The academic indicator includes two measures: English Language Arts (ELA) and Mathematics. A school district or charter will receive a performance indicator in both of these measures, which demonstrates how students are performing in relation to their grade-level standards. The Smarter Balanced Summative Assessments and the California Alternate Assessments are the assessments used to generate these performance indicators. California students in grades three through eight and grade eleven take these assessments in the spring annually.
Chronic Absence (Priority 5)
Chronic absenteeism is defined as missing 10 percent or more of the instructional days that a student is enrolled to attend. On a 180-day school calendar, a student who misses 18 or more days would be labeled as chronically absent. Because regular attendance is vital to student learning and success, it is important to measure and reduce chronic absenteeism. The chronic absenteeism indicator is reflected on the Dashboard to provide a succinct view of this important data.
Graduation Rate (Priority 5)
The Graduation Rate indicator on the CA School Dashboard reflects the number of students who complete grade twelve and earn their high school diploma. Earning the high school diploma shows that a student has mastered the skills in their course of study that are determined to be foundational in the areas of reading, writing, and mathematics.
Suspension Rate (Priority 6)
The percentage of students who were suspended for one full day or more during the school year is used to generate the Suspension Rate indicator. If a student has been suspended more than once, that student is still only counted one time to generate the Suspension Rate.
College and Career (Priority 7 & 8)
The College/Career Readiness indicator uses a variety of college and career measures to reflect the amount of students who graduate high school more prepared for their college or career experience. For more information on college measures, one can research https://www.cde.ca.gov/ta/ac/cm/documents/ ccicollege.pdf or https://www.cde.ca.gov/ta/ac/cm/documents/ccicareer.pdf for more info on career readiness.

Local Level Indicators
As outlined above, the CA accountability model is based on multiple measures that outline how local educational agencies (LEAs) and schools are meeting the needs of their students. These measures, or indicators, are based on the Local Control Funding Formula (LCFF) priorities as well as measures required by the Every Student Succeeds Act (ESSA). For priorities that do not have data collected as a state-level indicator, a local indicator is displayed instead. The process for collecting data for the local indicators is through a set of State Board of Education (SBE) adopted self-reflection tools. According to the California Department of Education (CDE), LEAs must (CDE, 2024):
“Annually measure its progress in meeting the requirements of the specific LCFF priority; and
Report the results as part of a non-consent item at a regularly scheduled public meeting of the local governing board/body in conjunction with the adoption of the LCAP; and
Report results to the public through the Dashboard utilizing the SBE-adopted self-reflection tools for each local indicator.”
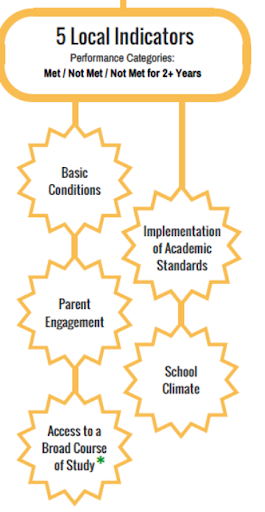
The following Local Indicators are displayed on the CA School Dashboard in alignment with the LCFF priorities:
Basic Services- Appropriately Credentialed and Assigned Teachers, Access to curriculum-aligned Materials, and Safe, Clean, and Functional School Facilities (Priority 1)
The self-reflection tool adopted by the SBE is used to share progress on the status of teachers who are appropriately assigned, as well as students’ access to instructional materials that are standards-aligned and safe, clean, and functional facilities at the school site.
Implementation of State Academic Standards (Priority 2)
Overall progress on the LEA’s implementation of the state’s academic standards is reported on the SBE-adopted self-reflection tool.
Parent Engagement (Priority 3)
The self-reflection tool adopted by the SBE provides LEAs with the opportunity to report on the progress toward family and parent engagement.
School Climate (Priority 6)
The SBE-adopted self-reflection tool for School Climate is used to demonstrate student feelings of being connected to school and school safety.
Access to a Broad Course of Study (Priority 7)
The self-reflection tool adopted by the SBE states the LEA’s progress towards enrolling and providing access to a broad course of study for all students.
In addition to these Local Indicators, there are two additional that are completed by County Offices of Education (Coordination of Services for Expelled Students – Priority 9 and Coordination of Services for Foster Youth – Priority 10).
For more information on the Local Indicators, please review: http://www.cde.ca.gov/ta/ac/cm/localindicators.asp
Status Levels
Performance on the state-level indicators is reported through the use of colors: blue, green, yellow, orange, and red. Blue represents the highest level of performance in that indicator and red represents the lowest level of performance. Performance levels are determined using two years of data (current year performance, otherwise referred to as, “Status,” and the difference from the prior year to indicate drowth or decline, referred to as, “Change.”
There are also five levels used to indicate a change in the performance between the current and prior year data. The change levels are: “Increased Significantly, Increased, Maintained, Declined, and Declined Significantly.” As an example, a district that had “High” performance on an indicator that mirrored its prior year performance would then fall within the “Maintained” change level.

