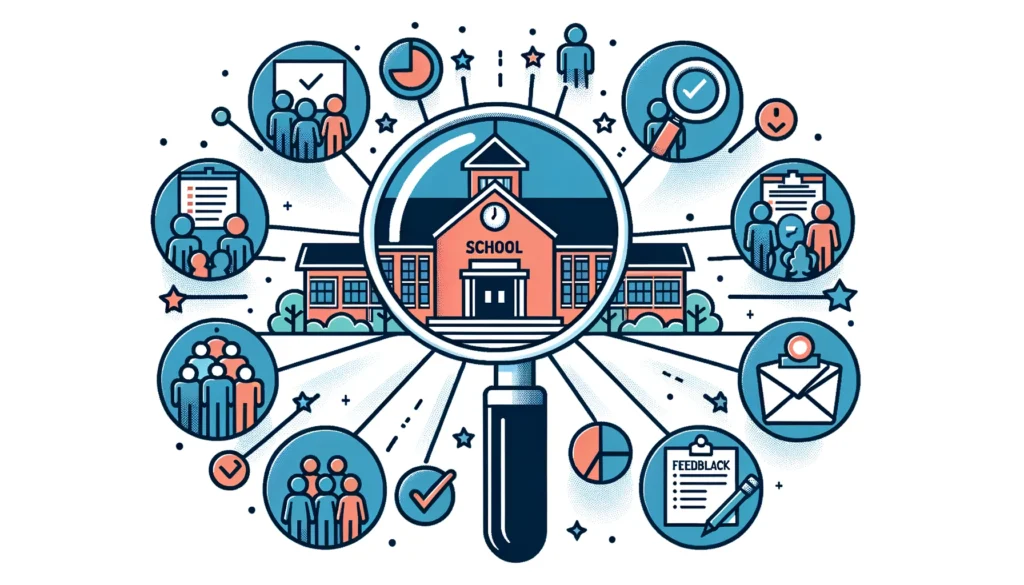
The Stages of K12 Data
People often think about data in terms of a graph or table of information. That is one form of data, but it is helpful to think about school data across six distinct stages to effectively manage and use data in our schools:
Stage 1 - Preparing
Prepare surveys, assessments, tests, and other tools to check the current reality
Stage 2 - Collecting
Collecting data through tests, surveys, enrolment applications, etc.
Stage 3 - Storing
Storing data online or local computers in large databases
Stage 4 - Summarizing
Summarizing data into tables, charts & graphs for people to explore
Stage 5 - Analyzing
Analyzing data for patterns and trends to make insights and draw conclusions
Stage 6 - Reporting
Reporting data as a story that informs and inspires action
Schools may have different staff who are responsible for these different stages of data and sometimes school system outsource the stages to state agencies, non-profit organizations, or vendors. For example, most school districts don’t create their own assessments or their own student information systems (SIS) but some districts maintain their own databases to store the data.
A common mistake is made when we don’t distinguish between the summarizing, analyzing and reporting of data. There are times when a group of people need data summarized because they need to go through a data analysis activity, but at other times, it might be most helpful to do the analysis and reporting so an audience can understand the story behind the data.

