The Importance of Putting Data in Context
By itself, a piece of data doesn’t tell the audience much. For example, knowing that 50% of the students at a school can read at grade level means something very different to different communities. In some communities, that could be considered great news but in other communities it might not be good news.
To say something meaningful about the data, there needs to be some context to compare the information to, such as the “baseline data” to measure improvement.
- Consider one school that typically has 60% of their students reading on grade level.
- Consider a second school that typically has 40% of their students reading on grade level
How might the staff at each school feel about results showing that 50% of their students are reading on grade level?
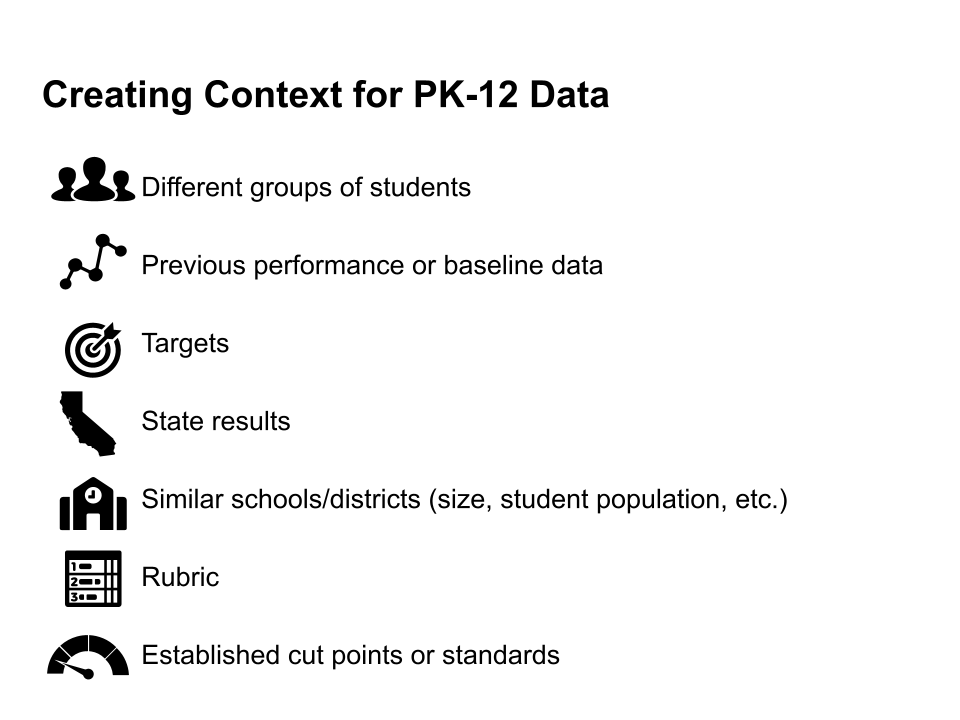
To evaluate a program, we need to provide context to the outcomes. There are many ways to provide context to your data, some are listed below.

For schools and school districts in California, the two most common ways of providing context to the data are
- Comparing a school’s results from one year to the previous year
- Comparing a schools results to the District, County, and State averages
These are easy ways to make comparisons but how good is the comparison if schools are different sizes, or have students from different socioeconomic backgrounds, or have different rates of mobility?
When analyzing and reporting data, consider which context will provide the best information for your particular audience and purpose.
Footnote: Currently the State of California measures progress of schools based on their average scores from one year to the next but is also considering how to measure progress by looking at the changes in scores for individual students from one year to the next. This would be a better measure of a school’s impact on the students.

